PanelOS
Software for 3.5-inch USB PC screens: temperatures, watts, a local clock, weather for a city you set, and now playing from Windows, in six themes.
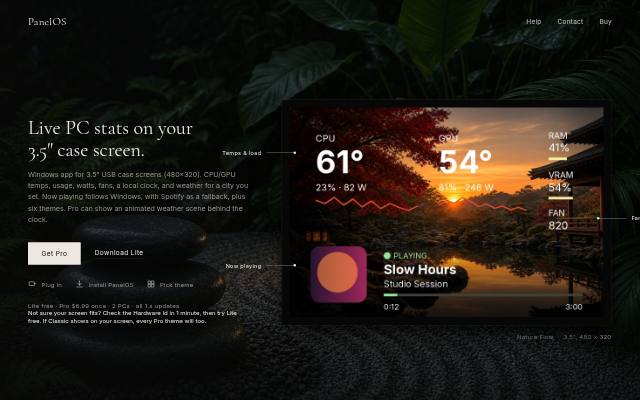
PanelOS is commercial monitoring and observability software made by Emir Mrkaljevic. Compare it with other monitoring and observability tools.
- Made by
- Emir Mrkaljevic
- Source code
- Closed
Judgement
- What it is
- Complete system
- What it does
- Windows tray app that drives the small 3.5-inch USB screens sold for PC cases, showing temperatures, power draw, a clock, weather and what is playing.
- Adopt it when
- You have one of these USB sensor screens and want something better than the software it came with.
- Watch out
- Made by one person, Windows only, and it supports particular screen models, so check yours is on the list.
- Ready for
- Usable
- Runs as
- Desktop app
- What the license allows
- Closed source: you use it under the maker's terms and cannot change or resell the code.
Judged on 2026-11-08 from the maker's description and Wikipedia. The license and age lines are worked out directly.
Open-source alternatives to PanelOS
-
1
Uptime Kuma louislam
A fancy self-hosted monitoring tool
Complete system Production-ready You want an easy, UptimeRobot-style monitor on your own server for a homelab or small business.
★ 93k MIT JavaScript Active, pushed 4 days ago -
2
OneUptime OneUptime
Complete open-source monitoring and observability platform.
Complete system Usable You want to replace several tools like StatusPage, PagerDuty and Pingdom with one self-hosted product.
★ 7.8k See repository TypeScript Active, pushed 4 days ago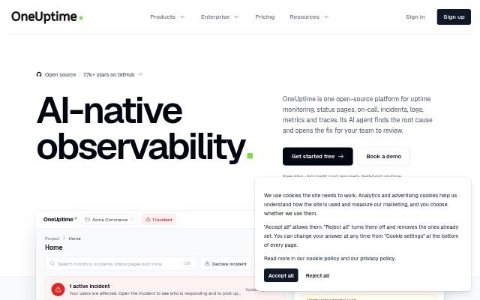
-
3
Netdata netdata
The fastest path to AI-powered full stack observability, even for lean teams.
Complete system Production-ready You want detailed server and container monitoring running within minutes without building Prometheus and Grafana yourself.
★ 81k GPL-3.0 Go Active, pushed 4 days ago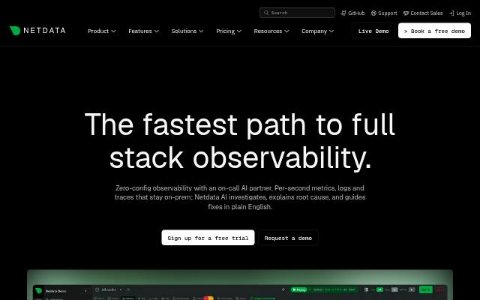
-
4
Prometheus prometheus
The Prometheus monitoring system and time series database.
Complete system Production-ready You run services or Kubernetes and need metrics and alerting with the de facto standard toolset.
★ 67k Apache-2.0 Go Active, pushed 2 days ago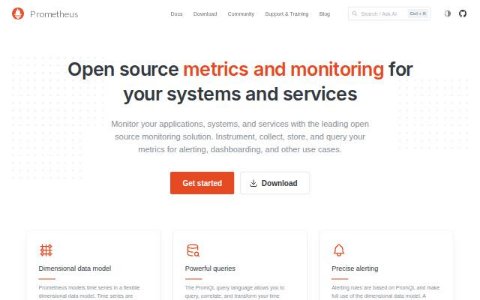
-
5
Grafana grafana
The open and composable observability and data visualization platform. Visualize metrics, logs, and traces from multiple sources like Prometheus, Loki, Elasticsearch, InfluxDB, Postgres and many more.
Complete system Production-ready You need shared dashboards and alerts across several data sources, self-hosted or on Grafana Cloud.
★ 78k AGPL-3.0 TypeScript Active, pushed 4 days ago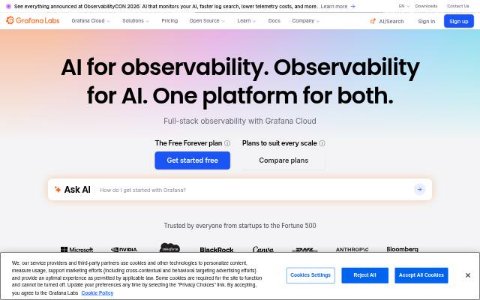
-
6
Loki grafana
Like Prometheus, but for logs.
Complete system Production-ready You already use Prometheus and Grafana and want low-cost centralised logs.
★ 29k AGPL-3.0 Go Active, pushed 4 days ago
-
7
SkyWalking apache
APM, Application Performance Monitoring System
Complete system Production-ready You run many JVM microservices and want a self-hosted APM with automatic agent instrumentation.
★ 25k Apache-2.0 Java Active, pushed 4 days ago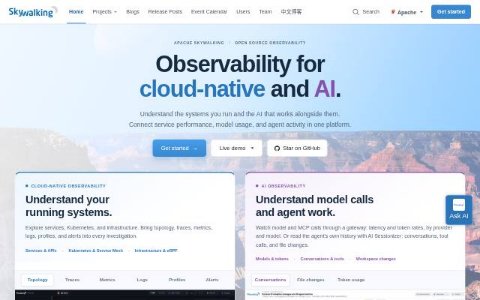
-
8
Jaeger jaegertracing
CNCF Jaeger, a Distributed Tracing Platform
Complete system Production-ready You need self-hosted tracing to follow requests through services and find latency problems.
★ 23k Apache-2.0 Go Active, pushed 4 days ago
-
9
Witr pranshuparmar
Why is this running? Trace any process, port, container, or file back to what started it - CLI + TUI.
Developer tool Usable You often find mystery processes or ports on servers and want a quick answer to 'why is this running'.
★ 23k Apache-2.0 Go Active, pushed 15 days ago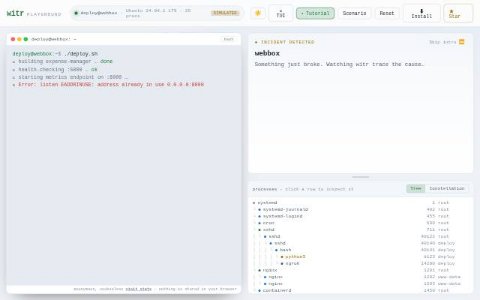
-
10
Vector vectordotdev
A high-performance observability data pipeline.
Complete system Production-ready You need a fast, single-binary agent or aggregator to reshape and ship telemetry, for example to cut observability costs.
★ 23k MPL-2.0 Rust Active, pushed 4 days ago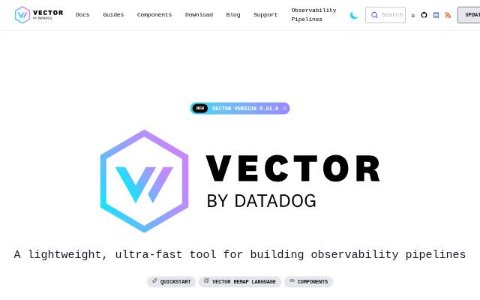
Other commercial monitoring and observability tools
-
1
FireHydrant FireHydrant
All-in-one incident management software for modern teams. FireHydrant helps you plan, respond, and resolve faster with smart alerting, on-call scheduling, AI-powered workflows, and post-incident retros.
Complete system Production-ready An engineering team wants structured incident processes and a service catalogue outside PagerDuty.
Commercial
-
2
Honeybadger Honeybadger Industries
Real-time error tracking, APM & logging for your favorite stack. Helps developers find and fix issues faster. Get started for free.
Complete system Production-ready A small team, especially a Rails shop, wants errors, uptime and job monitoring from one simple vendor.
Commercial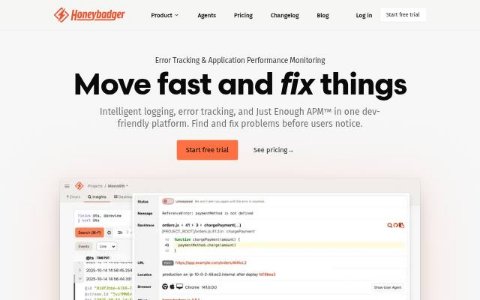
-
3
Honeycomb Honeycomb.io
Honeycomb is the observability platform built for AI-era software. Fast queries, unified telemetry, and LLM observability. Used by Slack, Intercom, and Dropbox.
Complete system Production-ready Engineers debugging distributed systems need to slice traces by any attribute, not just predefined dashboards.
Commercial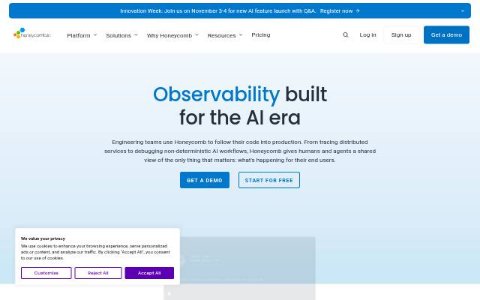
-
4
incident.io incident.io
incident.io is a software reliability platform unifying on-call, agentic root cause analysis, incident response, and status pages – helping teams resolve issues faster.
Complete system Production-ready An engineering team coordinates incidents in Slack and wants on-call and response in one modern tool.
Commercial
-
5
Instatus Instatus
Create a free status page in seconds. Monitor your services, fix incidents with your team, and share your status with customers.
Complete system Production-ready A startup wants a good-looking status page cheaply.
Commercial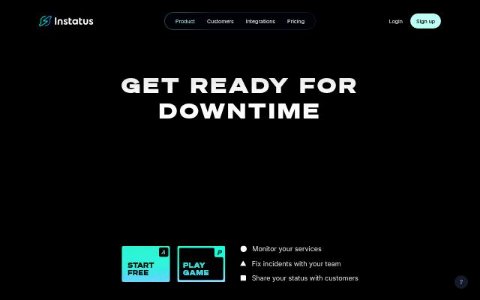
-
6
Papertrail SolarWinds
Papertrail lets you search, react, and resolve infrastructure issues instantly with real-time log tailing. Sign up and start debugging.
Complete system Production-ready A small team wants hosted log tailing and search set up in minutes, without running its own log stack.
Commercial
-
7
Raygun Raygun
Raygun gives you a window into how users are really experiencing your software applications. Detect, diagnose and resolve issues that are affecting end users.
Complete system Production-ready A team, often on .NET, wants crash reports and real user performance data in one hosted product.
Commercial
-
8
Rollbar Rollbar
Error monitoring for software teams, Resolve to open a tested fix, and Rollbar Lines to work your whole backlog on your own systems. Free plan available.
Complete system Production-ready A team wants a hosted error tracker focused on errors and deploys rather than full observability, with a free plan to start.
Commercial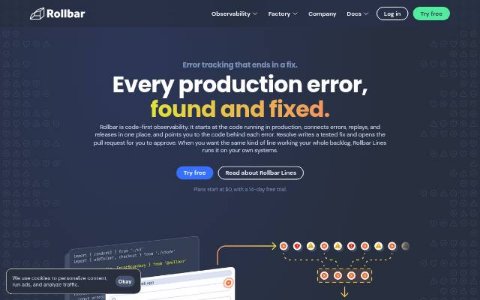
-
9
Rootly Rootly
The all-in-one AI incident management platform for fast-moving engineering teams to detect, manage, resolve, and learn from incidents faster.
Complete system Production-ready A fast-moving engineering team wants configurable incident workflows in Slack as an alternative to incident.io.
Commercial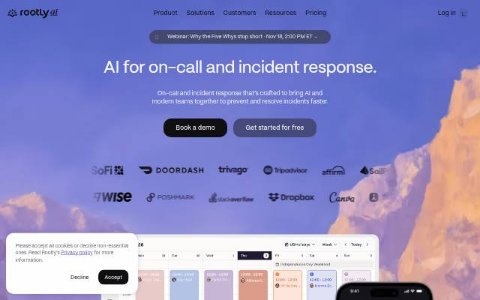
-
10
Sentry Functional Software, Inc.
Application performance monitoring for developers & software teams to see errors clearer, solve issues faster & continue learning continuously. Get started at sentry.io.
Complete system Production-ready Almost any software team that ships code to users and wants to see errors as they happen, with SDKs for most languages.
Commercial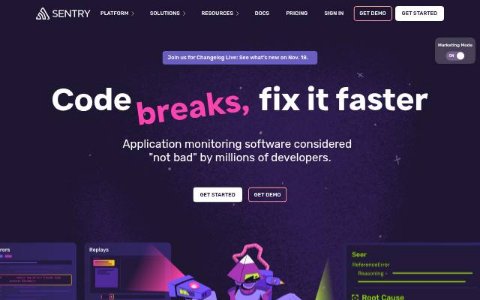
Under it
Every program, PanelOS included, runs on a microchip.
Made this? Add the badge

<a href="https://assemblyline.org/software/product/panelos"><img src="https://assemblyline.org/software/badge/product/panelos.svg" alt="Listed on Assembly Line" width="190" height="32"></a>The description is the maker's own, quoted as written.