Tracely
Trace-native CI/CD for AI agents: grade production traces, cluster failures, freeze them into replayable regression tests, and block PRs that regress. Self-hostable.
Tracely is an open-source monitoring and observability project on GitHub under the MIT license (permissive), with 1k stars. It is built with CPython, TypeScript, Redis and minio. Its last push was 3 days ago.
- Stars
- 1k
- License
- MIT
- Activity
- Active
Judgement
- What it is
- Complete system
- What it does
- Grades AI agent traces as they arrive, clusters failures into issues, freezes bad runs into replayable regression tests, and blocks pull requests that would bring them back. Includes an API, worker, UI and a Python SDK.
- Adopt it when
- You run AI agents in production and want real failures turned into tests that gate your pull requests.
- Watch out
- Under a month old with no release, and the full stack needs Postgres, ClickHouse, Redis and MinIO.
- Ready for
- Experimental
- Runs as
- Self-hosted server and cloud service
- Built with
- Python, TypeScript, ClickHouse, Postgres and Redis
- How established
- New: started under a month ago, no tagged release yet.
- What the license allows
- You can build it into a product you sell, as long as you keep its copyright notice.
Judged on 2026-11-06 from the project's README and GitHub data. The license and age lines are worked out directly.
Compare Tracely
Built from
Follow it down: Tracely → CPython → GCC → LLVM project → runs on a microchip
Open-source alternatives to Tracely
-
1
Uptime Kuma louislam
A fancy self-hosted monitoring tool
Complete system Production-ready You want an easy, UptimeRobot-style monitor on your own server for a homelab or small business.
★ 93k MIT JavaScript Active, pushed 3 days ago -
2
Netdata netdata
The fastest path to AI-powered full stack observability, even for lean teams.
Complete system Production-ready You want detailed server and container monitoring running within minutes without building Prometheus and Grafana yourself.
★ 81k GPL-3.0 Go Active, pushed 2 days ago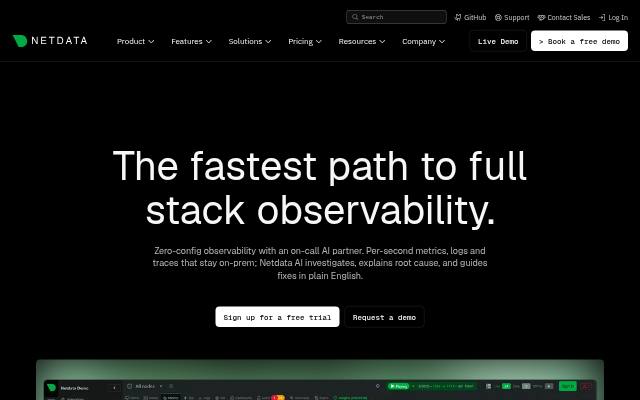
-
3
Grafana grafana
The open and composable observability and data visualization platform. Visualize metrics, logs, and traces from multiple sources like Prometheus, Loki, Elasticsearch, InfluxDB, Postgres and many more.
Complete system Production-ready You need shared dashboards and alerts across several data sources, self-hosted or on Grafana Cloud.
★ 78k AGPL-3.0 TypeScript Active, pushed 2 days ago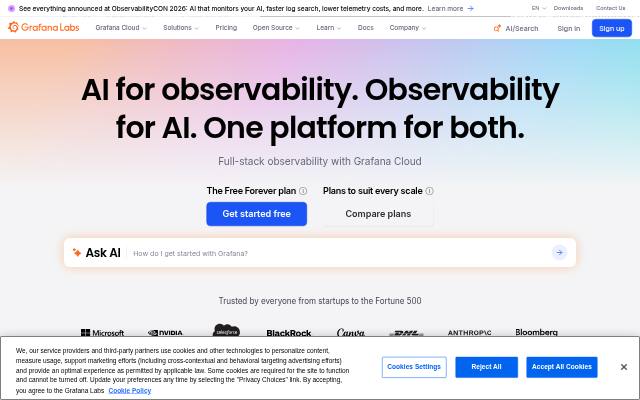
-
4
Prometheus prometheus
The Prometheus monitoring system and time series database.
Complete system Production-ready You run services or Kubernetes and need metrics and alerting with the de facto standard toolset.
★ 67k Apache-2.0 Go Active, pushed today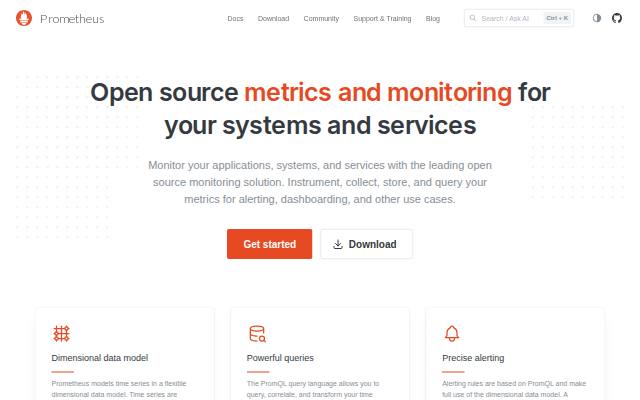
-
5
Loki grafana
Like Prometheus, but for logs.
Complete system Production-ready You already use Prometheus and Grafana and want low-cost centralised logs.
★ 29k AGPL-3.0 Go Active, pushed 2 days ago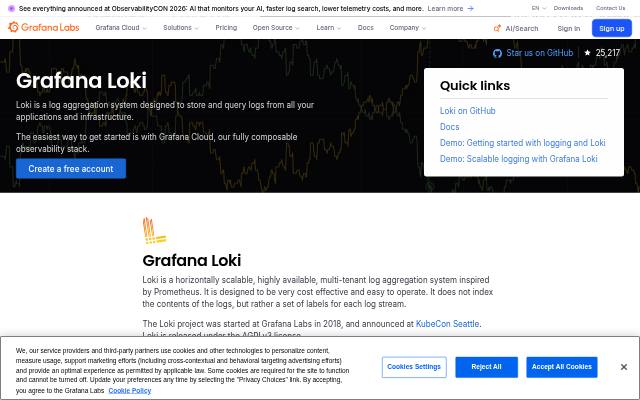
-
6
SkyWalking apache
APM, Application Performance Monitoring System
Complete system Production-ready You run many JVM microservices and want a self-hosted APM with automatic agent instrumentation.
★ 25k Apache-2.0 Java Active, pushed 2 days ago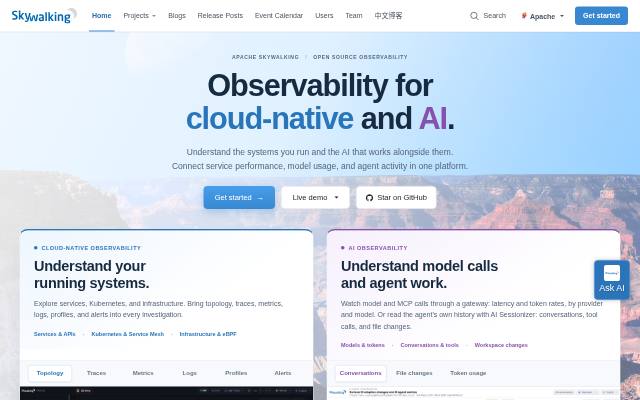
-
7
Jaeger jaegertracing
CNCF Jaeger, a Distributed Tracing Platform
Complete system Production-ready You need self-hosted tracing to follow requests through services and find latency problems.
★ 23k Apache-2.0 Go Active, pushed 3 days ago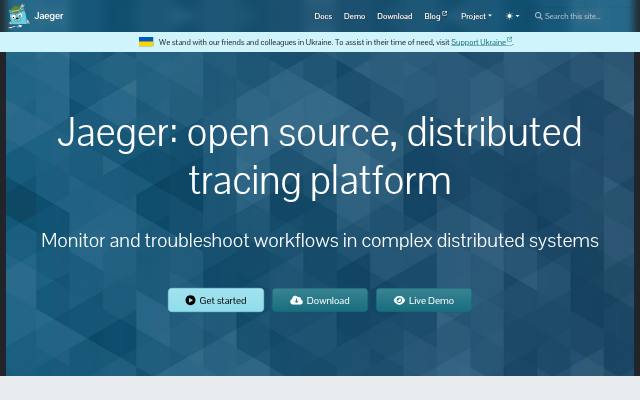
-
8
Witr pranshuparmar
Why is this running? Trace any process, port, container, or file back to what started it - CLI + TUI.
Developer tool Usable You often find mystery processes or ports on servers and want a quick answer to 'why is this running'.
★ 23k Apache-2.0 Go Active, pushed 13 days ago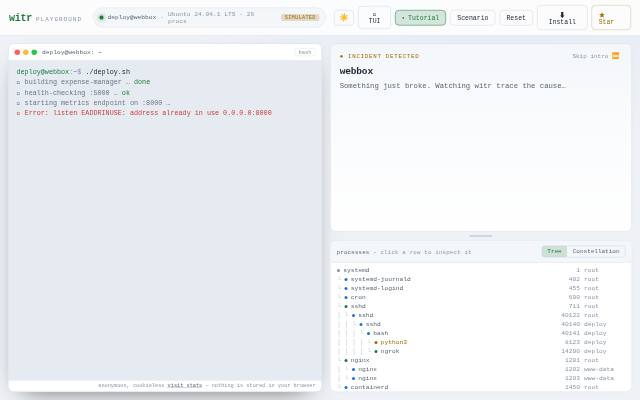
Commercial monitoring and observability tools
-
1
Datadog Datadog, Inc.
See metrics from all of your apps, tools & services in one place with Datadog’s cloud monitoring as a service solution. Try it for free.
Complete system Production-ready An engineering organisation wants every observability signal in one well-integrated product and has the budget.
2.4k readers a month Since 2010 Commercial -
2
Grafana Cloud Grafana Labs
Monitor metrics, logs, traces, and profiles with Grafana Cloud—an AI-powered, fully managed observability platform built on leading open source tools.
Complete system Production-ready A team likes Grafana and open-source standards and wants them managed, with the option to self-host later.
1.7k readers a month Since 2014 Commercial -
3
Dynatrace Dynatrace
Innovate faster, operate more efficiently, and drive better business outcomes with observability, AI, automation, and application security in one platform.
Complete system Production-ready A large enterprise with complex hybrid environments wants automatic discovery and causal problem detection.
1k readers a month Since 2005 Commercial -
4
Atlassian Statuspage Atlassian
Statuspage keeps users informed during incidents. Communicate real-time service status, cut duplicate support tickets, and build customer trust.
Complete system Production-ready A SaaS company wants the familiar status page format customers expect, especially if it uses Atlassian tools.
Commercial -
5
New Relic New Relic, Inc.
New Relic is an AI-powered observability platform that correlates your telemetry across your entire stack, so you can isolate the root cause and reduce MTTR.
Complete system Production-ready A team wants full-stack observability with a generous free tier and usage-based pricing.
685 readers a month Since 2008 Commercial -
6
PagerDuty PagerDuty, Inc.
Turn incidents into intelligence. PagerDuty's AI-first Operations Platform helps you automate, resolve, and prevent critical issues — from detection to resolution.
Complete system Production-ready An organisation runs critical services with formal on-call rotations and needs reliable paging.
366 readers a month Since 2009 Commercial
Stars, license and activity come from GitHub and refresh on a rolling hourly schedule. The project's own description is quoted as written.